Timeseries Chart Workflow
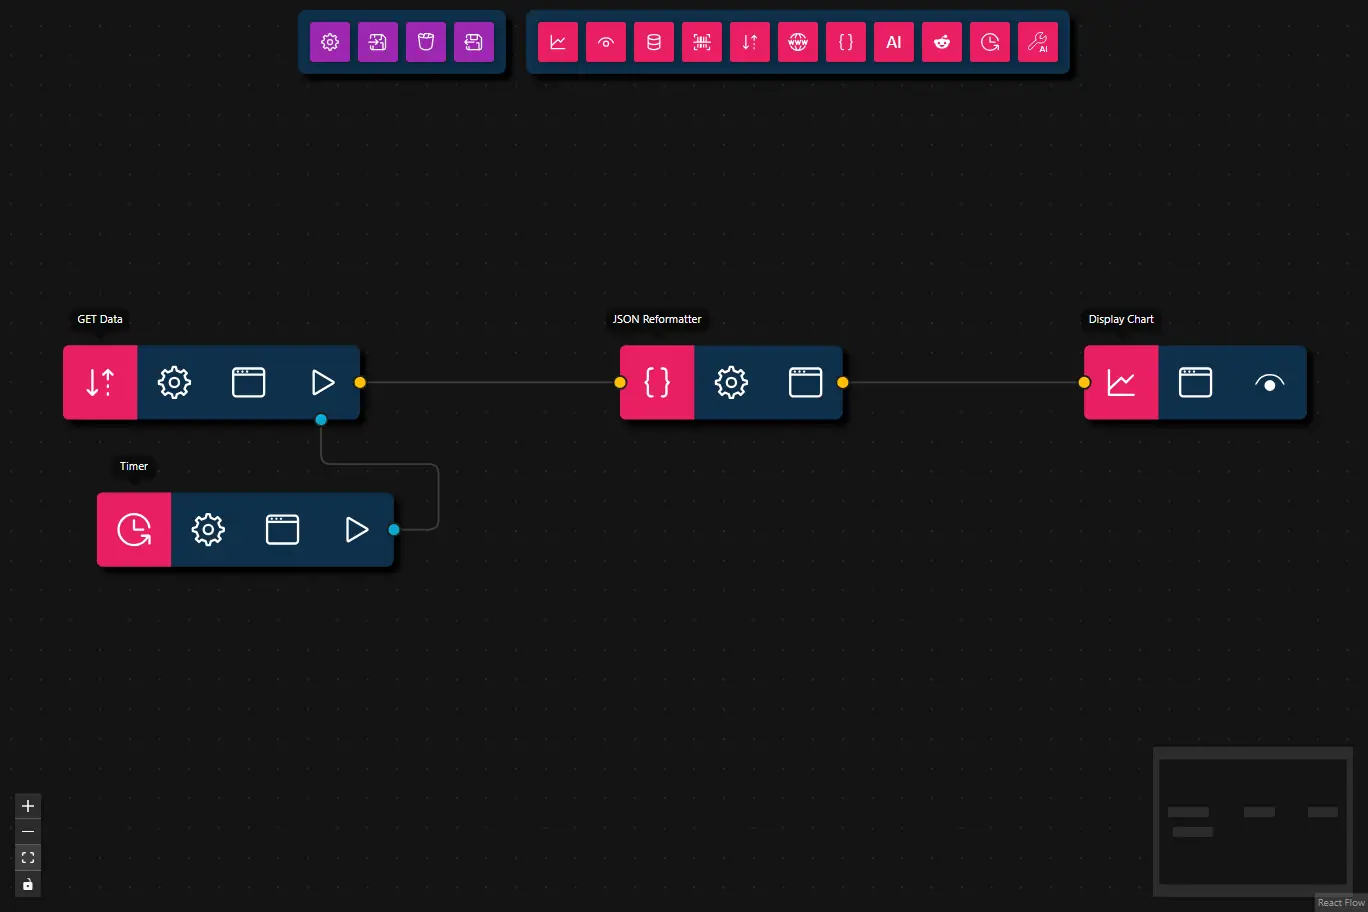
This workflow fetches time series data from an API, reformats it for charting, and displays it as a chart.
- Preview
- JSON
- Node Configuration
{
    "nodes": [
        {
            "id": "94ccc828-cf75-4323-9273-f7144e539181",
            "type": "get-data",
            "position": {
                "x": 100,
                "y": 100
            },
            "data": {
                "title": "GET Data",
                "url": "https://www.alphavantage.co/query?function=TIME_SERIES_INTRADAY&symbol=IBM&interval=5min&apikey=demo",
                "dataType": "json",
                "dataProvidedByUpstream": false
            },
            "measured": {
                "width": 160,
                "height": 40
            },
            "selected": false,
            "dragging": false
        },
        {
            "id": "591a8b24-e0ea-4f38-b3ac-b633f2584444",
            "type": "chart",
            "position": {
                "x": 650,
                "y": 100
            },
            "data": {
                "title": "Display Chart"
            },
            "measured": {
                "width": 120,
                "height": 40
            },
            "selected": false,
            "dragging": false
        },
        {
            "id": "5ab7119f-bef6-46b3-8de8-a9437b2109e9",
            "type": "json-reformatter",
            "position": {
                "x": 400,
                "y": 100
            },
            "data": {
                "title": "JSON Reformatter",
                "jsonataExpression": "(\r\n  $series := $lookup($, \"Time Series (5min)\");\r\n  $ts := $reverse($keys($series));\r\n  $symbol := $lookup($lookup($, \"Meta Data\"), \"2. Symbol\");\r\n  {\r\n    \"labels\": $ts,\r\n    \"datasets\": [\r\n      {\r\n        \"label\": \"Open\",\r\n        \"data\": $map($ts, function($t) { $number($lookup($lookup($series, $t), \"1. open\")) })\r\n      },\r\n      {\r\n        \"label\": \"High\",\r\n        \"data\": $map($ts, function($t) { $number($lookup($lookup($series, $t), \"2. high\")) })\r\n      },\r\n      {\r\n        \"label\": \"Low\",\r\n        \"data\": $map($ts, function($t) { $number($lookup($lookup($series, $t), \"3. low\")) })\r\n      },\r\n      {\r\n        \"label\": \"Close\",\r\n        \"data\": $map($ts, function($t) { $number($lookup($lookup($series, $t), \"4. close\")) })\r\n      }\r\n    ],\r\n    \"title\": $symbol\r\n  }\r\n)"
            },
            "measured": {
                "width": 120,
                "height": 40
            },
            "selected": false,
            "dragging": false
        },
        {
            "id": "b68794e4-ea77-4d51-8da5-372c052a3e28",
            "type": "timer",
            "position": {
                "x": 118.25,
                "y": 179.25
            },
            "data": {
                "title": "Timer",
                "mode": "interval",
                "interval": 60,
                "immediate": true,
                "runOnce": false
            },
            "measured": {
                "width": 120,
                "height": 40
            },
            "selected": false,
            "dragging": false
        }
    ],
    "edges": [
        {
            "type": "smoothstep",
            "animated": false,
            "source": "94ccc828-cf75-4323-9273-f7144e539181",
            "sourceHandle": "flow",
            "target": "5ab7119f-bef6-46b3-8de8-a9437b2109e9",
            "targetHandle": "flow",
            "id": "86e4943f-6025-498b-816b-2250e8c36a96"
        },
        {
            "type": "smoothstep",
            "animated": false,
            "source": "5ab7119f-bef6-46b3-8de8-a9437b2109e9",
            "sourceHandle": "flow",
            "target": "591a8b24-e0ea-4f38-b3ac-b633f2584444",
            "targetHandle": "flow",
            "id": "2b844d7c-0729-485f-bfe6-b89bc75618cd"
        },
        {
            "type": "smoothstep",
            "animated": true,
            "source": "b68794e4-ea77-4d51-8da5-372c052a3e28",
            "sourceHandle": "trigger",
            "target": "94ccc828-cf75-4323-9273-f7144e539181",
            "targetHandle": "trigger",
            "id": "xy-edge__b68794e4-ea77-4d51-8da5-372c052a3e28timer-trigger-94ccc828-cf75-4323-9273-f7144e539181timer-trigger"
        }
    ]
}
- GET Data
- URL: Alpha Vantage API endpoint for intraday time series (e.g., IBM stock)
- Data Type: JSON
- JSON Reformatter
- Tool: Applies a JSONata expression to transform the time series data for charting
- Chart
- Displays the formatted data as a chart
- Timer Node
- Interval:
60seconds - Trigger immediately:
true
- Interval:
Steps
- Fetch Data: The workflow starts by retrieving time series data from the Alpha Vantage API.
- Reformat Data: The JSON Reformatter node applies a JSONata expression to transform the raw time series data into a chart-friendly format.
- Visualize: The Chart node displays the formatted data as a chart.
- Repeat: The Timer node triggers the workflow at a set interval (60 seconds), automatically updating the data and chart.