Stock Analysis Tool
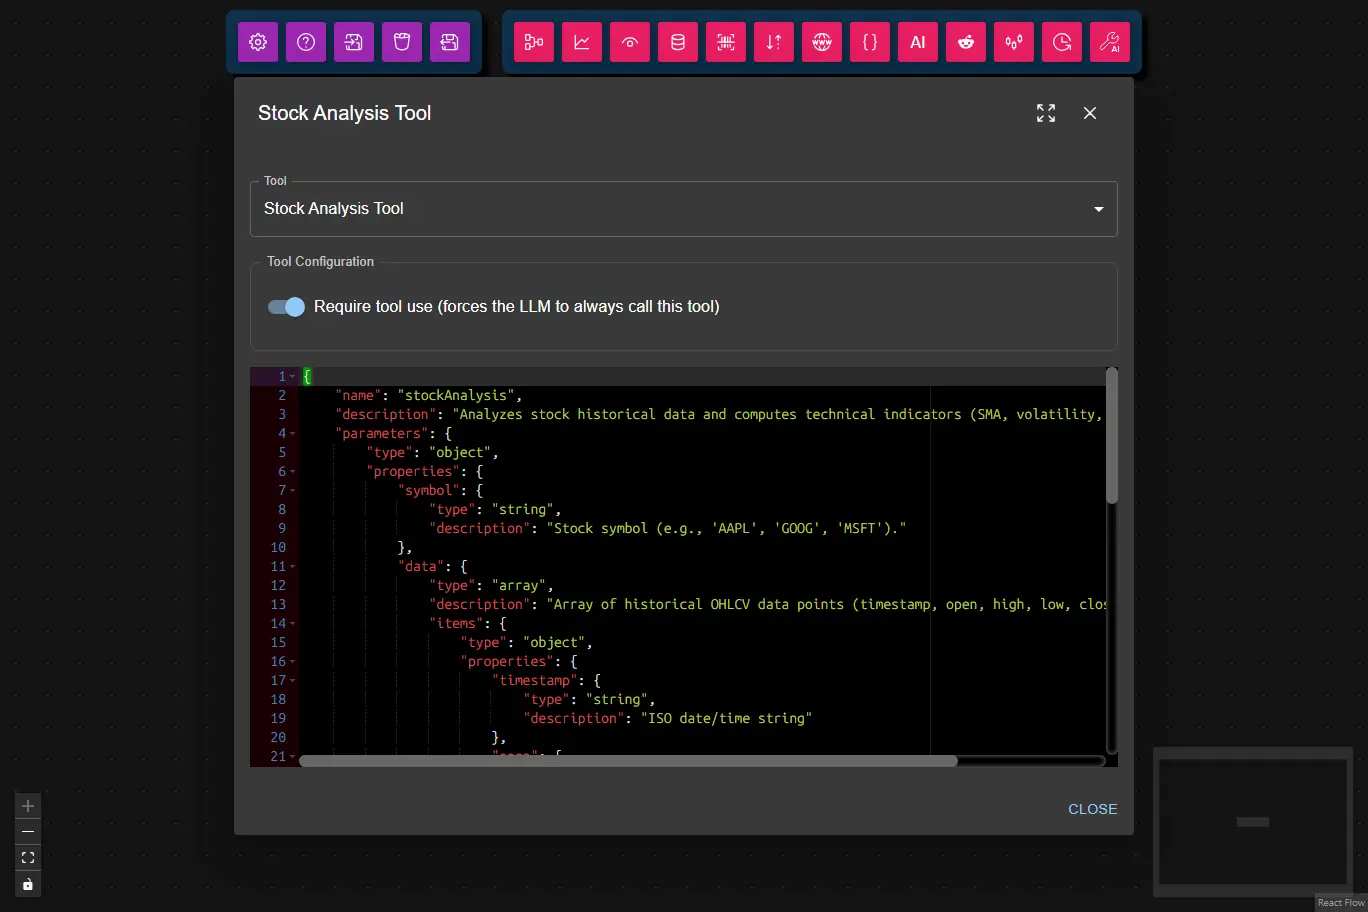
The Stock Analysis Tool analyzes historical stock data and computes technical indicators including moving averages, volatility, trend classification, and more.
It is useful for workflows that require stock market analysis or need to process OHLCV (Open, High, Low, Close, Volume) data.
- Inputs
- Outputs
- Node Type
symbol¹ (string): Stock symbol (e.g.,"AAPL","GOOG","MSFT")data¹ (array): Array of historical OHLCV data points (minimum 10 points required)- Each data point must include:
timestamp(string): ISO date/time stringopen(number): Opening pricehigh(number): Highest pricelow(number): Lowest priceclose(number): Closing pricevolume(number): Trading volume
- Each data point must include:
requireToolUse(boolean, user config): Require tool use (forces the LLM to always call this tool; default: true)Note: When enabled, the node will retry tool calls up to the number of times set in Max Tool Retries in the AI Data Processing Node.
(1) Provided by the AI Data Processing Node as a result of processing it's input.
symbol: Stock symbol that was analyzedclose: Most recent closing pricepctChange: Percentage change from previous closesma5: Simple Moving Average (5 periods)sma10: Simple Moving Average (10 periods)volumeRatio: Ratio of current volume to average volume (last 10 periods)slope: Trend slope (price change over 10 periods)volatility: Price volatility (standard deviation of last 10 closes)trend: Trend classification ("up","down", or"sideways")analysisPeriod: Object containingstartandendtimestamps of the analysis period
Example Output:
{
    "symbol": "AAPL",
    "close": 178.45,
    "pctChange": 0.0234,
    "sma5": 176.82,
    "sma10": 174.56,
    "volumeRatio": 1.23,
    "slope": 0.389,
    "volatility": 2.14,
    "trend": "up",
    "analysisPeriod": {
        "start": "2026-03-20T00:00:00Z",
        "end": "2026-04-05T00:00:00Z"
    }
}
ai-tooltoolSubtype:stock-analysis